This site uses cookies to improve your experience. To help us insure we adhere to various privacy regulations, please select your country/region of residence. If you do not select a country, we will assume you are from the United States. Select your Cookie Settings or view our Privacy Policy and Terms of Use.
Cookie Settings
Cookies and similar technologies are used on this website for proper function of the website, for tracking performance analytics and for marketing purposes. We and some of our third-party providers may use cookie data for various purposes. Please review the cookie settings below and choose your preference.
Used for the proper function of the website
Used for monitoring website traffic and interactions
Cookie Settings
Cookies and similar technologies are used on this website for proper function of the website, for tracking performance analytics and for marketing purposes. We and some of our third-party providers may use cookie data for various purposes. Please review the cookie settings below and choose your preference.
Strictly Necessary: Used for the proper function of the website
Performance/Analytics: Used for monitoring website traffic and interactions
In today’s discussion we’ll break down where the CEO comparison holds up, where it falls short, and most importantly what makes product management a uniquely challenging and rewarding role in its own right.
This was time-consuming but once it was done, things felt faster by comparison. Lovable had got us this far, but now we made a conscious switch to Cursor. There was no way to migrate from Lovable, so we built our site again from scratch. Cursor gave us Vanilla JS instead, with no need for external libraries or frameworks.
Top 7 real user monitoring tools for product teams Before we discuss each tool in detail, check out this comparison table of popular solutions for a quick overview: ->FOR LANA -> ADD THE TABLE FROM NOTION 1.
Choosing the Right AI Tools When it comes to selecting AI tools for product development, Mike shares several practical approaches to compare different models: 30-Minute Evaluation Method Quick Comparison Method Create test scenarios Open multiple tool windows Test across different AI models Input identical prompts Score responses systematically Compare (..)
This guide is intended to assist your buying decision with side-by-side comparisons of graph databases from Amazon, DataStax, Neo4j, and TigerGraph. Selecting a graph database is an important decision that can shape the success of your organization.
Looking at your product’s recent feature additions, how many were driven by competitor comparison versus genuine customer needs? Consider Anya’s example of having customer service representatives purposefully engage with users to gather product development insights.
Understanding the impact of these investments in terms of both time and money makes the stakes easier to understand when comparing these kinds of projects with new features, even if the comparison can never be apples to apples. We recommend looking at 75th percentile values for comparison initially.
Here you can view key results through easy visualizations and comparisons. Participant recruiting : Outsource the work of finding the right participants for your study, freeing you up to focus on the more important strategic parts. For each task participants must perform, Optimal Workshop has a dedicated task results tab.
Speaker: Robert Webber, VP Product Flow Optimization at Construx
Many development organizations are pushed into outsourcing by executives tantalized by hourly rate comparisons. If you are debating on whether building or buying is best for your organization, make sure your decision is based on financial merit, not an hourly rate comparison. There are good alternatives to outsourcing available today.
Importantly, competitor analysis is not the same as a product comparison. Step 4: Summarise Competitor Strategy and Positioning Once youve gathered your data, organise it into a simple comparison table. annual reports) Observable data : Derived from observation and synthesis (e.g.
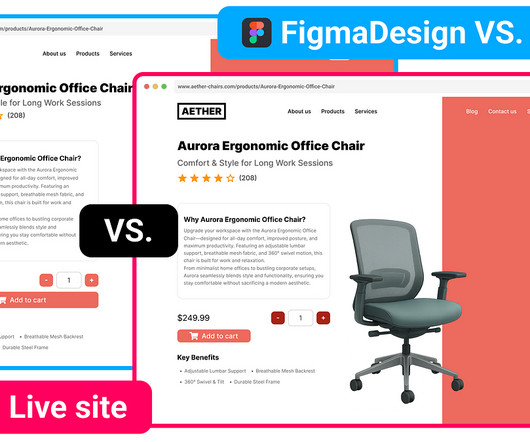
For our comparison, I will be using the landing page of a food delivery service. For example, in my case, I will use the React and Shadcn combination simply because I want to do an apples-to-apples comparison with the Figma Make. Regardless of the tools you choose to use, ensure that you’re utilizing auto-layout. React and MUI).
When it comes to A/B testing , AI-driven tools can automate the comparison of multiple design versions, gathering data to show which options resonate best with users. Rapid prototyping and building user journeys is one area where AI shines, enabling teams to quickly create, test, and iterate on design concepts.
If youve ever tried evaluating product tour tools, you know the surface-level comparisons dont tell you much. Best product tour tools in comparison When I was evaluating product tour software, most tools either looked polished or had depth, but rarely both. Custom pricing only (typically 5-figures+ annually).
User Intent Many users expressed an interest in leveraging Civians data for investment research, market comparisons, or understanding neighborhood trends. comparison tools and filtering methods). Since statistics are only visible for one community at a time, comparison of these insights becametough.
Comparison Insight: 90% of software companies are embedding analytics tools in their applications, significantly improving customer experience and product differentiation. Real-World Example If product analytics shows a high abandonment rate during a workflow, you might embed a dashboard or visualization that makes the workflow clearer.
Live, side-by-side comparison: Whether two monitors or an overlay tool, reduce tab-switching. What “Good” Design QA Looks Like Single shared checklist : Typography, spacing, colors, interaction states, accessibility. One doc, version-controlled. QA mid-sprint, not post-build: Designers review feature branches before code merges to main.
Size and fit guides: Interactive size charts, comparisons, virtual try-ons. High-quality images and video: From all angles, with real sizes, in context (e.g., a garment worn by a model with different proportions). User reviews and photos: Real reviews and photos from other customers that help new buyers make an informed decision.
This guide breaks down: PM salaries by level (APM to Director+) Comparisons between FAANG (now MAANG) and startups Compensation components: base, bonus, RSUs, and more Real-time data sources and salary benchmarks Let’s dive into what PMs are really earning in 2025—and how you can maximize your take-home.
These digital marketplaces act as intermediaries between car dealers and buyers, offering a flexible and comprehensive car shopping experience and providing customers with an extensive selection of cars across different years, models, andmakes.
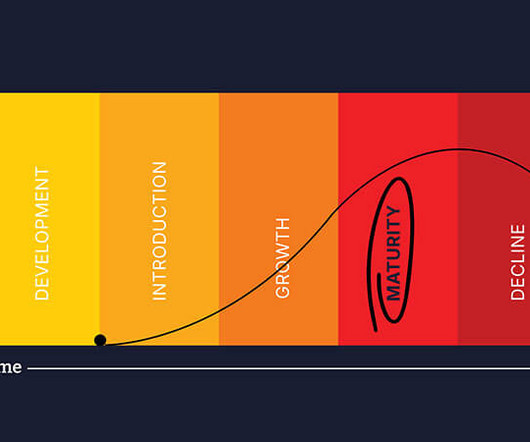
Focus Areas For The Maturity Stage While the maturity stage often gets a bad rap in comparison to the growth stage, it is important to note that this stage by far generates the most benefits for the business. Inevitably however a product will start to move towards decline.
Traditional financial services often focus on interest rates, fees or product comparisons, but they miss the emotional side of money management. Neuroscience shows us that simplicity and clarity in digital interfaces can be far more persuasive and reassuring than an avalanche offacts. This is where neuroscience bridges the gap.
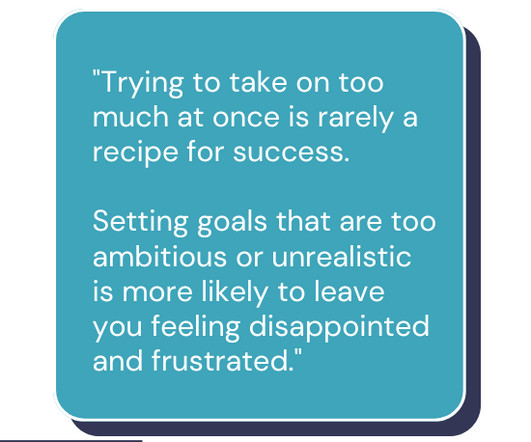
Or maybe we get caught up in comparisons, hearing success stories from product peers at other companies that lead us to say, That could never happen here. Build an opportunity solution tree. Of course, just because something is simple doesnt mean that its easy. For many of us, the desire for perfection can be a real roadblock.
Best for : Software comparison and lead generation for vendors. You can also leverage the reviews to provide social proof to improve new customer acquisition. Product feedback software: G2. Capterra Type : Online review tool. Pricing : Custom pricing for vendors.
To enter: [link] Where to find Claire Vo: ChatPRD: [link] Website: [link] LinkedIn: [link] X: [link] In this episode, we cover: ( 00:00 ) Introduction to GPT-5 ( 04:34 ) Testing GPT-5 in ChatPRD for document generation ( 07:10 ) Comparing GPT-5 and GPT-4.1
If a digital solution already exists that you have to re-engineer, conduct a quick usability testing to get a SUS score ; this will also act as a comparison guide for your future designs. For example, before train ticketing apps, people used to book tickets from ticket windows. Ask them what is good and bad about their current process.
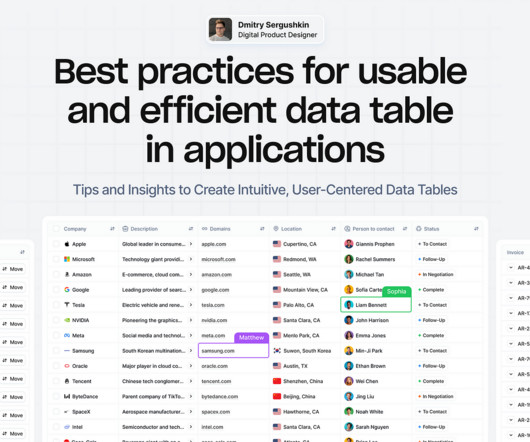
Especially when scanning large datasets or doing comparisons, denser layouts can reduce time spent paging or scrolling. While giving more white space for table rows and dropping vertical lines does simplify the table UI, many B2B users prefer to see more data on a screen at once — even if that reduces the readability or visual aesthetics.
This alignment standard ensures that textual content is easy to scan, while numeric data aligns neatly, making comparisons between values more intuitive forusers. Align Text and Numbers for Better Readability Left-align text and right-align numeric values in table columns to improve readability and clarity.
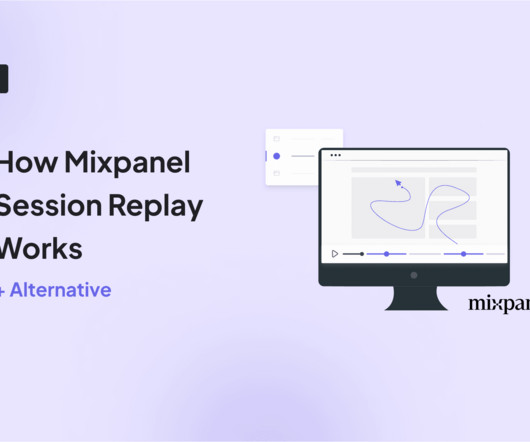
If you’re considering the Mixpanel session replay feature, you’re probably wondering how it works, how much it costs, and whether it’s the right fit for your business. For this, let’s find out if these session recordings are worth buying and explore: What mixpanel session replay is and how it works.
My real UX solutions felt boring and clumsy by comparison. Mistake #1: Thinking Dribbble = UX Design When I was new to UX, I constantly compared my work to what I saw on Dribbble. Everything there looked so beautiful — perfect colors, stunning animations. But here’s the thing: Dribbble isn’t UX. It’s visual design.
Top 7 help center software for different use cases Go through the comparison table to see the comparison between the tools at a glance: Tool Pricing G2 rating Key Features Target persona Userpilot Starts at $249 monthly (billed annually) 4.6/5 5 No-code editor, various module groups, segmentation, localization, analytics dashboard.
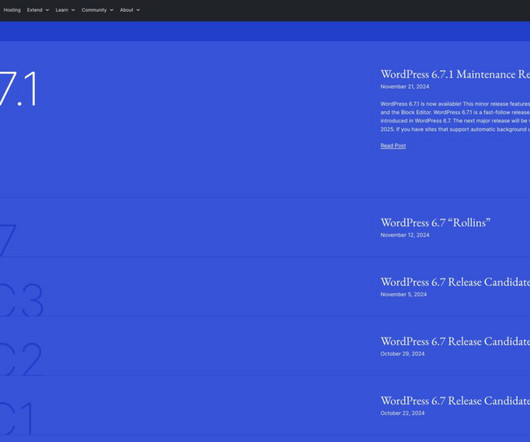
One standout feature is the inclusion of tag comparison URLs , which allow users to compare versions and identify whats new quickly. Sparse Context: Tagging comparisons without explanations may confuse users about the practical implications.
Fixed Lines: Set Key Benchmarks in Charts Static Reference Points: Easily highlight important thresholds for better comparisons. Improved Readability: More descriptive labels mean faster data interpretation. Customizable Appearance: Adjust line color and thickness for better visibility.
You can also visualize funnels in different formats for clearer comparisons. How Beable Leveraged Userpilot Analytics to Increase App Engagement Read to learn how Beable Education uses Userpilot analytics to measure its product performance and make informed decisions. Beyond numbers and stats, Userpilot also offers session replays.
Orta’s comparison to the “introduction of photography” period is particularly apt. The key insight is that these tasks “do not need to be treated as debt” when you have the right tools—they become manageable background work.
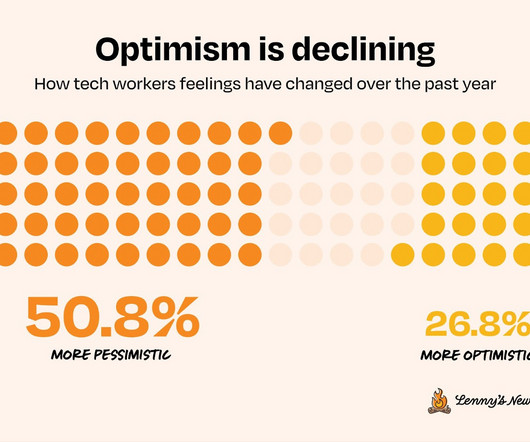
So we dug deeper into the comparison between current roles vs. long-term career prospects: 45.2% In both cases, the rest of the respondents selected “neutral.” ” We were curious to understand how each respondent views the future of their career compared with the future of their role.
Definitive Guide Training & Certification Use Cases Product Launch Testing Continuous User Testing Employee Dogfooding Competitive Testing Quality & Engineering Customer Support Product Managers CX / UX Researchers Beta Program Managers Consultants Comparisons vs. TestFlight vs. Instabug vs. BetaTesting.com vs. SurveyMonkey vs. UserTesting.com (..)
Here’s what your team should prioritize: Must-have features: Audience Segmentation: Create maps for specific user groups (new vs. returning visitors, mobile vs. desktop) Map Comparison: Easily compare results across different segments Page Templates: Aggregate data for similar page types (crucial for e-commerce sites) Mobile Optimization: Track (..)
Definitive Guide Training & Certification Use Cases Product Launch Testing Continuous User Testing Employee Dogfooding Competitive Testing Quality & Engineering Customer Support Product Managers CX / UX Researchers Beta Program Managers Consultants Comparisons vs. TestFlight vs. Instabug vs. BetaTesting.com vs. SurveyMonkey vs. UserTesting.com (..)
A global retailer engaged an external partner for endtoend development of a mobile loyalty app, including integration with POS systems, analytics dashboards, and thirdparty loyalty providers. The vendor managed cloud infrastructure, data pipelines, and security certifications, delivering a turnkey solution within budget.
Heres how Userpilot can help you make this comparison: imagine you localized your app for Spanish speakers in Spain and Mexico. Significant differences in engagement that didnt exist prior to the localization effort suggest that there could be variations in local expectations or cultural preferences that require a more nuanced approach.
comparison posts, product lists, reviews, etc.) If youre running paid campaigns, ROAS helps measure how much revenue your ads generate in comparison to the amount spent. So instead of spamming generic, top-of-funnel content, I invite you to diversify your SEO strategy. Create BoFu content early (e.g., Customer acquisition cost ( CAC ).
We organize all of the trending information in your field so you don't have to. Join 96,000+ users and stay up to date on the latest articles your peers are reading.
You know about us, now we want to get to know you!
Let's personalize your content
Let's get even more personalized
We recognize your account from another site in our network, please click 'Send Email' below to continue with verifying your account and setting a password.


Let's personalize your content