This site uses cookies to improve your experience. To help us insure we adhere to various privacy regulations, please select your country/region of residence. If you do not select a country, we will assume you are from the United States. Select your Cookie Settings or view our Privacy Policy and Terms of Use.
Cookie Settings
Cookies and similar technologies are used on this website for proper function of the website, for tracking performance analytics and for marketing purposes. We and some of our third-party providers may use cookie data for various purposes. Please review the cookie settings below and choose your preference.
Used for the proper function of the website
Used for monitoring website traffic and interactions
Cookie Settings
Cookies and similar technologies are used on this website for proper function of the website, for tracking performance analytics and for marketing purposes. We and some of our third-party providers may use cookie data for various purposes. Please review the cookie settings below and choose your preference.
Strictly Necessary: Used for the proper function of the website
Performance/Analytics: Used for monitoring website traffic and interactions
By the time youve optimized for a particular KPI, your competition may already be moving on to the next opportunity. Metrics are another comforting illusion. They provide numbers that seem to quantify success. But metrics are often backward-looking.
A close look at key performance indicators (KPIs) and the impact they have on the efficacy of UserExperience (UX). A great understanding about how KPIs can inform your UX research on both a qualitative and quantitative level. The post How to assess the efficacy of UX: KPI methods appeared first on TryMyUI Blog.
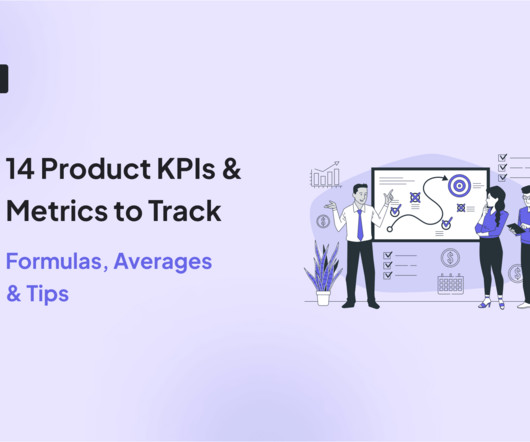
Do you need some behavioral KPI examples to understand what metrics to track and why? Behavioral key performance indicators (KPIs) can help you understand userexperience and measure feature adoption. Tracking behavioral KPIs is essential for understanding customers and improving their userexperience with your products.
Userexperience is the concept of gauging the satisfaction or frustration of your users while they interact with your product/service. Optimizing the user’sexperience throughout their journey is one of the best ways to improve your brand image and secure lasting engagement.
With no-code user onboarding tools , it’s easy to start building onboarding journeys that don’t reflect reality—all in a vain attempt to get new users to activate faster so they don’t churn. Userexperience journey mapping makes us ask this question: How do users move through their own goals, not our hoops?
Product managers are aware of the basic KPI metrics to measure for their mobile app, but there are a handful of underestimated KPI metrics that product managers need to measure as well. An important KPI metric to focus on here is the average time between each consecutive step.
Example of anOKR: Objective: Improve the userexperience of the checkoutprocess. Key Performance Indicators (KPIs) KPIs are ongoing performance metrics used to track the health and effectiveness of a product or design. KPI: Monitor drop-off rate, engagement, and time to purchase.
Top KPIs in organizations might include sales revenue, customer value, conversion rates, inbound marketing ROI, and site traffic to name a few. For decades, userexperience professionals have been debating how to associate experience measures with these key KPIs. View it today. About the webinar speaker.
Make UX A Part of the KPI Conversation With Universal Measures. Make UX A Part of the KPI Conversation With Universal Measures Key Performance Indicators or KPIs are basic measures that are often front in center in most board rooms. She's led global userexperience teams and helped grow UX capacity for dozens of organizations.
3) Embed the Mission and KPI Within the Teams. Above all, the validity of the KPIs must be revisited periodically. Focus is essential in order to deliver value to users and to capture value for the organization. They should be able to answer the basic question of “are we focusing on the right things?”
Customer journey KPIs, alongside product analytics , help product teams understand if they’re meeting their goals. This insight can help you make informed decisions to optimize your userexperience. Consider both leading (future-oriented) and lagging (past outcome-based) indicators for the KPIs.
To calculate: Activation rate Measures the percentage of users who get to their first “aha” moment. To collect the data to measure this KPI, you need to define what activities make up an “aha moment.” You can identify those activation points by figuring out what your most successful user cohort accomplished before they subscribed.
At FreeAgent, as soon as a KPI goes red, a team can switch off whatever they’re doing and divert resource to fix it. Pulling these metrics and indicators together into a scorecard that is understood across the organisation, democratises the appreciation of where the product is.
Design to Your KPI. I don’t think that the sheer number of UFs sold was Starbucks’ leading KPI for this product. I’d propose that their primary KPI was shares and exposure, and for that they did a marvelous job. @oceanslimebakery posted: “I had to go to three different Starbucks to get this!”
As companies usually have many different KPIs, maintaining or growing customer retention is a key KPI that each business commonly shares. You might also be interested in Mobile app KPI dashboard examples and how to use them What is customer retention and why is it so important?
Having trouble deciding which customer service KPI to use? There are some vanity metrics among the KPIs for customer service. So let’s look at the most important KPIs that will help you create strategies to provide superior customer service and boost retention. Customer service KPI #1 Customer Satisfaction Score.
A crew’s happiness is directly related to the quality of their outputs and so is measured as any other KPI would be. In addition to a higher quality userexperience, this approach increases the speed at which you can pull together new designs, thus enabling faster testing of new ideas in a real environment.
10 Customer retention KPIs and metrics to measure retention. Here are 10 of the most important KPIs and metrics that help you measure customer retention rate. Retention KPI #1 Customer retention rate. Customer retention rate is the percentage of users who continued to use your product after their initial purchase.
Or that an OKR is the same as a KPI. UX (UserExperience) and UI (User Interface) design are, in the grand scope of tech roles, somewhat similar. UX, or UserExperience design, was first laid out by Don Norman in his 1988 book The Design of Everyday Things.
UX KPIs, or userexperience key performance indicators, are essential numerical data points that are used to track, measure, and compare the experienceusers have with your SaaS product. Userexperience (UX) involves all aspects of user interactions with your product.
We have a collection of top UX KPIs and a framework to connect UX KPIs to business KPIs published by UX Magazine. For those that are interested in linking UX metrics with business KPIs I recommend watching this webinar: Make UX part of KPI conversations. Enterprise applications with consumer grade userexperiences.
We once had a situation where, if a user killed and re-opened the app, they could bypass a test, which muddied the results. Tests can be hard to QA if there are several variants, if the test touches many parts of your product, or if changes in the userexperience are supposed to happen at a future date. Test your tests.
Best way to track and measure product management KPIs. Product management KPIs help product teams outline and track the business or product success. KPI stands for Key Performance Indicator, and OKR stands for Objectives and Key Results. What’s the difference between KPIs and OKRs? Let’s get started!
The reason for this trend is because late discovery of extreme application latency typically leads to brand compromises on userexperience in favor of time to market and/or the release may be delayed allowing an extended code undoing, a very expensive task for developers, and one teams are looking for eliminate.
A key result is not the same thing as a KPI (key performance indicator). A KPI is used to measure the continued progress towards a defined performance measure. Improve UserExperience. Increase new user base by 10% end of Q2 2021 Expand usage of existing accounts by 5%. Key Results. Increase Membership Numbers.
OKRs are different from KPIs because a KPI is strictly a metric that reflects performance. There are two main performance frameworks in product marketing – OKRs and KPIs. Meanwhile, a KPI is a single metric that gives a reflection of performance in one area. Grow Monthly Active Users (MAU) by 12%.
On the flip side, that’s also just a very crappy userexperience. That’s something that has a high impact on retention, especially for the more advanced users. The post Metrics that matter to Primephonic: the KPI that drives product roadmap prioritization appeared first on Mixpanel. We’re still a startup.
On the flip side, that’s also just a very crappy userexperience. That’s something that has a high impact on retention, especially for the more advanced users. The post Metrics that matter to Primephonic: the KPI that drives product roadmap prioritization appeared first on Mixpanel. We’re still a startup.
Strategic differentiation could be better data that you have access to, a simpler userexperience, more sophisticated functionality, a cost advantage, or so many other elements of differentiate too numerous to list. Once you've defined the metrics, it's important to develop benchmarks for them.
Retention is a metric that measures how many users return to your product over a period of time and considered to be one of the most important KPIs when trying to analyze the product health or potential, it is a key indicator for growth and impacts almost every key business metric (e.g. DAU, Stickiness, LTV and more).
Long term, you can expect to manage a specific KPI (e.g., improve first userexperience, reduce churn, etc.), I am personally a big proponent of the associate product manager track. That’s the best way to get your hands dirty in the game. product offering, entire product portfolio, or product team.
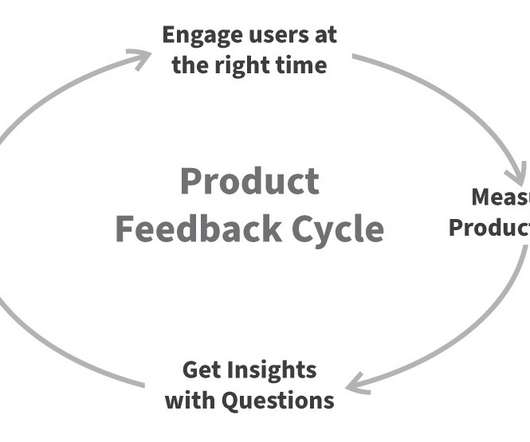
Looking to build better userexperiences? It’s time to stop passively observing your analytics and start engaging your users. Here is why user engagement is the new key to build innovative experiences. It all starts with user feedback. And it doesn’t involve tracking every action your users do.
With that said, we still spend a lot of time talking to the Dribbble Community and asking them about their experience, the platform and how we can ultimately improve. One of the investments we’re making is carving out a proper userexperience research function in our internal design team.
Requirements Experience: A proven track record of building and leading product teams, ideally in fast-paced, scaling environments, with experience in AI, onboarding, or growth-related domains. Excellent Product Taste: You love creating beautiful, delightful userexperiences and staying current with trends in the SaaS and AI industries.
There’s no single KPI to measure customer satisfaction. However, the most relevant include: Customer satisfaction score ( CSAT ): the percentage of users who report being satisfied with a product, service, or specific interaction. What is the KPI for customer satisfaction?
Collect user feedback to understand friction points. Gathering user feedback can help you identify where they encounter difficulties. This insight allows you to make necessary adjustments to improve the userexperience. Iterate on core features based on user behavior. CES formula.
PMMs use product analytics to gain actionable insights into their customers' experiences, understand what's driving success and what's causing friction in the user journey to help the customer achieve repeated value by using the product. KPI and other custom-built dashboards. User property attachments.
A healthy level of questioning helps to confirm and validate the design, architecture, and userexperience choices. Product dark periods will cause product teams to question just about everything. This can be beneficial and harmful. Successful products are often won or lost during dark periods.
For instance, if your goal is to expand your user base , the number of monthly active users (MAU) is a suitable KPI. It ensures that you provide a consistent userexperience across all channels. Step 10: Analyze user satisfaction in-app Powerful marketing can help you rope in new users.
It’s a great KPI to evaluate the effectiveness of your onboarding process, as well as identify opportunities to streamline the user journey. Shorter times indicate a more intuitive and efficient onboarding process that quickly leads users to understand and experience value from your product.
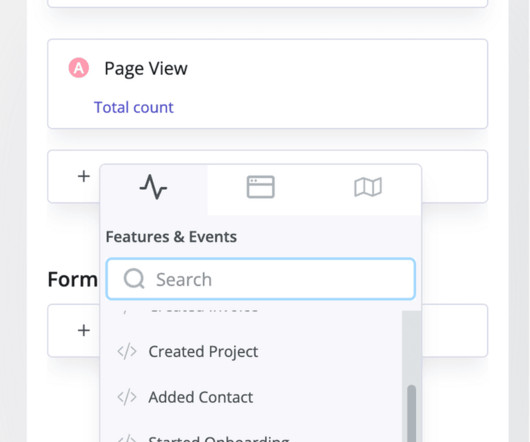
By examining trends reports, you can see the rise and fall of each KPI, allowing you to spot abnormalities easily. This report is particularly useful when you make changes to your product or conduct an experiment and want to see how it impacts results. Funnel analysis report. Features and events dashboard in Userpilot.
Product challenges Product health metrics are one of the most important KPI sets to track when running SaaS businesses. Product experience The term product experience (PX) may not be as popular in the SaaS industry as userexperience (UX), but it’s equally important.
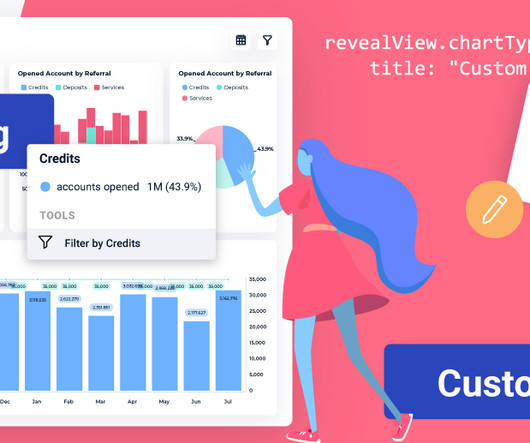
RevealView now automatically resizes itself when its container changes size, enhancing the overall userexperience. The custom theme font now correctly affects the KPI visualization, ensuring a consistent look and feel across your reports.
These metrics can highlight opportunities for improvement that lead to a more polished userexperience. Unlike product metrics , KPIs are higher-level indicators that measure the success of your product marketing strategy. User activation rate formula.
We organize all of the trending information in your field so you don't have to. Join 96,000+ users and stay up to date on the latest articles your peers are reading.
You know about us, now we want to get to know you!
Let's personalize your content
Let's get even more personalized
We recognize your account from another site in our network, please click 'Send Email' below to continue with verifying your account and setting a password.


Let's personalize your content