This site uses cookies to improve your experience. To help us insure we adhere to various privacy regulations, please select your country/region of residence. If you do not select a country, we will assume you are from the United States. Select your Cookie Settings or view our Privacy Policy and Terms of Use.
Cookie Settings
Cookies and similar technologies are used on this website for proper function of the website, for tracking performance analytics and for marketing purposes. We and some of our third-party providers may use cookie data for various purposes. Please review the cookie settings below and choose your preference.
Used for the proper function of the website
Used for monitoring website traffic and interactions
Cookie Settings
Cookies and similar technologies are used on this website for proper function of the website, for tracking performance analytics and for marketing purposes. We and some of our third-party providers may use cookie data for various purposes. Please review the cookie settings below and choose your preference.
Strictly Necessary: Used for the proper function of the website
Performance/Analytics: Used for monitoring website traffic and interactions
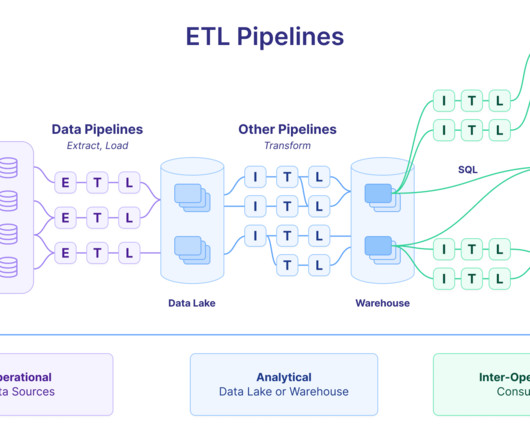
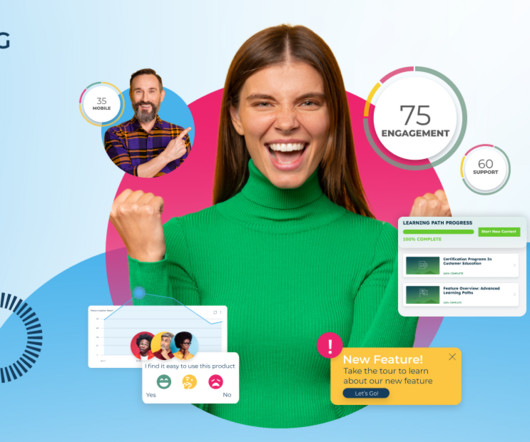
How to plan a dashboard people will use: 10 Key Steps Dashboard user interface elements in light and dark modes Our team has built dashboards for a wide range of businesses, and we’ve picked up a few key insights along the way. Define use cases and users Spell out the business tasks and map your users. Where is the visual focus?
Instead of sifting through endless data, teams can create bar charts to compare metrics or line charts to track trends over time and spot patterns quickly. For example, when launching a new feature, the right data visualization tool will let you track user interactions through a funnel report.
Notion and Slack are the CRM and customer support surprises. We’ll include GitLab next time to get a better sense of its use too. And as you’ll see below in the section on switching tools, users aren’t happy about using Teams. Two hypotheses: People do not think highly of the Teams userexperience.
Coding Focus: Both disciplines will test your ability to write clean, efficient code under time constraints. Behavioral Interviews: You’ll be asked questions to understand your past experiences, problem-solving skills, and cultural fit. Meta Handling Large-Scale User Data and Ensuring Privacy Importance of data privacy (e.g.,
Speaker: Sam Owens, Product Management Lead, Namely Platform
Sam and Jessica faced a problem that many product managers face: their customers wanted better analytics and reporting, but analytics wasn’t the core function of the SaaS product Sam and Jessica manage. To make things tougher, they needed something flexible, scalable and capable of serving different user types.
Sample questions : Write a query to calculate total revenue per customer. Use window functions to rank customer purchases by date. Type 4: Behavioral type of “SQL experience Question” “Tell me about a time you optimized a SQL query to improve performance.” What does COALESCE() do in a query?
✅ This guide was written by Alex Reyes , a senior technical recruiter with 20+ years of experience. TL;DR A well-structured data analyst resume: has detailed, hands-on data experience, highlights projects and impacts, and includes Technical Skills and Relevant Education sections. Write a resume that attracts more interviews.
What Google’s and Salesforce’s respective acquisition of Looker and Tableau Software means for CIO’s The BI analytics tool space is consolidating to compete against Microsoft’s ensemble of Business Analytics(BA) products which promises to solve for the entire workflow?—?data With Google’s announcement to buy Looker for $2.6b
Experts predict the Customer Analytics market will top $24 billion by 2025. Organizations need customer data to provide the empathetic, personalized experiencescustomer demand—and to stay competitive. But inside many companies, customer data sits in silos, requiring technical know-how to access and analyze it.
Speaker: Eric Feinstein, Professional Services Manager, Looker
For a long time, Product Managers have found it challenging to design interfaces inside their products that users could use for reporting. Eric Feinstein, Professional Services Manager at Looker, has done workshops with product managers who are looking to add effective reporting. Building a team to support your deployment.
Originally published June 2, 2022 By Brian LaFaille, former Global Head of CS Strategic Programs at Looker Digital Customer Success is for everyone. This is the message that has echoed across LinkedIn and in the wider CS community for some time. The natural next step is to segment your customers based on ARR.
Known as the Martech 5000 — nicknamed after the 5,000 companies that were competing in the global marketing technology space in 2017, it’s said to be the most frequently shared slide of all time. According to SiriusDecisions, 92% of B2B marketers consider ABM “extremely” or “very” important to their marketing efforts.
We recently reached 1,800,000 current account customers – after launching in January 2018 – and are focusing on growing our user base and revenue. In the same time, we’ve grown overdraft usage from zero to over 100,000 people, and revenue from zero to break-even on a per customer basis.
Unlike traditional data analysis methods, self-serve analytics equips everyone in your organization to explore data and take the right actions in real time. TL;DR Self-service analytics is a business intelligence (BI) approach that empowers users to access, analyze, and interpret data without relying on IT or data teams.
Speaker: Richard Cheng, Associate Product Manager, Mark43
To fix traditionally paper-heavy and error-prone processes, they needed a secure and easy-to-use product experience that simplified and unified crime data collection and management. Haarthi Sadasivam, Technical Product Marketing Manager at Looker will join the conversation on best practices.
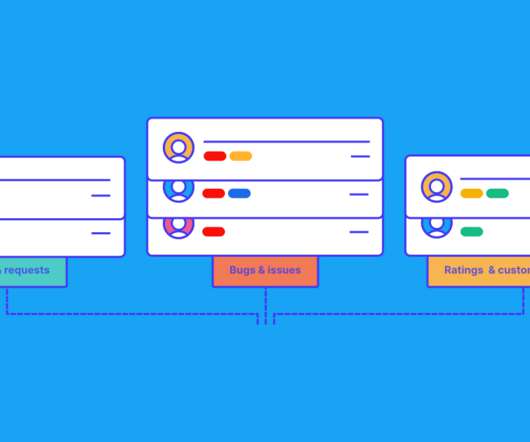
In practice, that means creating quality, communication, and operational programs that help product teams spend more time on their highest leverage activities like creating products and delivering value to the business. But fixing broken experiences is important. Key Tasks User issues reports. Product health tracking.
This is where tools such as Reveal and Looker come in handy – they convert raw data into easy-to-understand and easy-to-use insights that enable organizations to reshape and modernize the way they do business. What is Looker? What Is Looker? In 2019, Looker got acquired by Google and is now part of the Google Cloud platform.
Brought to you by: • WorkOS —The modern API for auth and user identity • Eppo —Run reliable, impactful experiments • CommandBar —AI-powered user assistance for modern products and impatient users — Todd Jackson is a Partner at First Round Capital.
Data is the most valuable asset of our time. In this article, you’ll learn about a new genre of customer analytics capabilities that speak the language of people, rather than systems. We live in accelerated times, and the companies that are winning the race for market share are the ones with the best understanding of their metrics. .
In 2019, industry-leading Business Intelligence tools (BI tools), Looker and Tableau, were acquired by Google and Salesforce for over $18 billion combined. Looker, and other tools like it, are often deployed with good intent. But it’s a solution that requires out-sized technical expertise, time, and resources.
It is important to customize the components of your analytics stack to meet your business’s unique needs. Events” are user actions, or what a company would define as a meaningful transactional moment. mParticle : mParticle is a mobile-first customer data platform that offers support for web data, too. Event Data. Major Players.
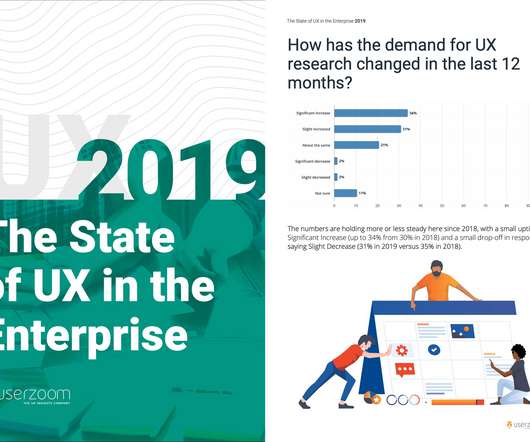
If you’re in the process of democratizing UX beyond the boundaries of your own UX team, and equipping other people in the organization with the skills to run their own research, s tandardization can increase efficiency and helps set expectations of what’s involved in a user research project. Download the library. Samantha Alaimo , Sr.
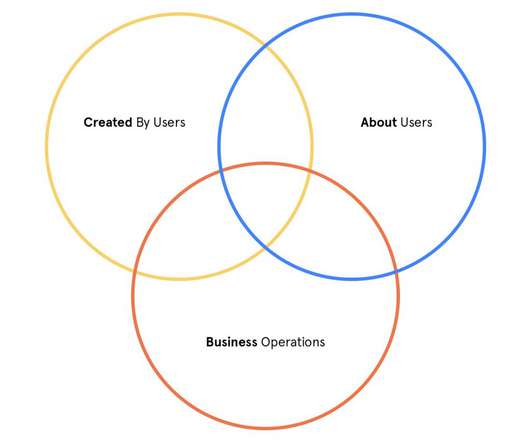
And yours is among all that data—data about and produced by your customers as well as data that’s central to your day-to-day business operations. As with many things in this life, organization is the first step to success, whether you’re looking to increase operational efficiency, improve userexperience, or innovate to grow market share.
The most important metrics to track are: Customer acquisition cost : The amount spent to acquire a new customer. The customer lifetime value : The total expected earnings of a single customer over their entire relationship. Conversion rate : The number of customers that convert into paying customers.
TL;DR Dashboards display critical business data in real-time, streamlining decision-making and focusing on key metrics. When choosing a dashboard tool, pay attention to the ease of use , customization, integrations , value, and data privacy to meet business needs effectively.
Our data scientists and analysts—with over 40 years of combined experience at companies including Zoom, Meta, Reddit, Twitter, and Google—require powerful and sophisticated tooling for business operation and revenue data analysis. Up until now, that was handled by Mixpanel and Looker, our BI (business intelligence) solution of choice.
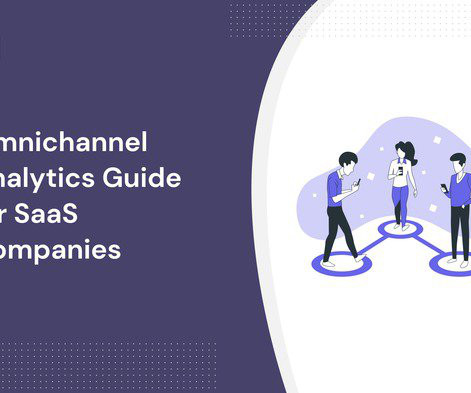
Omnichannel analytics enable teams to get a 360 view of user behavior at different touchpoints of the customer journey. Analyzing customer journeys across all channels allows teams to remove friction that stops users from progressing down the funnel. That’s what this article explores. Finally, act on the insights.
Current Company : Looker. Since the time of writing, Andrew has left Looker to start his own company. This was in 2014, around the time on-demand products were really picking up. My roomate at the time worked at Instacart and he persuaded me to join. How do they get me to spend so much time looking at memes?
From understanding the analytics landscape to mapping capabilities with KPIs and integrating new tools with your current stack, we know that choosing a product analytics solution can be overwhelming—not to mention, time-consuming. Marketing analytics help teams answer questions like: where are my users coming from? Source: Semetis.
Are you looking for Zendesk integrations to boost the efficiency of your self-service customer support? The article explores the best Zendesk integrations for: Customer support Customer feedback Productivity Email and social media communication Analytics and reporting Let's get right to it! If so, you’re in the right place!
Tracking cross-platform analytics is essential for product teams to see a complete view of customer behavior. TL;DR Cross-platform analytics is the activity of tracking and analyzing user behavior across multiple platforms or devices. Tools like Google Analytics or Amplitude allow you to track user behavior across all platforms.
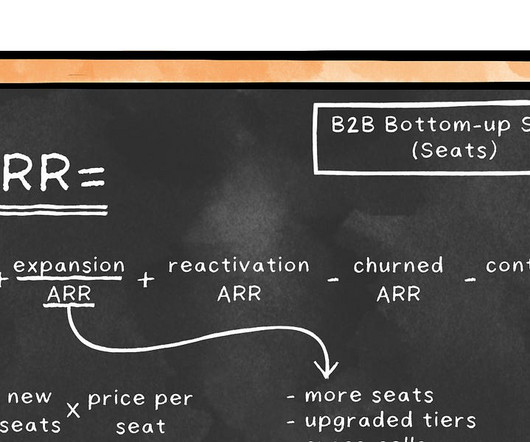
But once the equations are defined, your teams are aligned, and the equations operationalized, you’ll experience a huge force multiplier—because everyone will be focusing their energy on the same (high-leverage) levers. One key metric for every business is customer acquisition payback period. This won’t be perfect.
G2 has named Indicative as a Leader in Customer Journey Analytics in G2’s 2020 Summer Report. . Indicative is the only Customer Analytics platform designed specifically for non-technical business users that connects directly to your data warehouse. What Users Had To Say About Indicative. Why We’re Leaders.
Master Google Analytics 4 for user behavior analysis, UX design optimization, and enhanced website performance to improve sales. Let’s start, Google Analytics 4 is a powerful web analytics service that provides valuable insights into user behavior, engagement, website conversion, and much more. It’s six years old.
To quickly summarize, we collect marketing, sales, and product data from the relevant systems of record, merge them together in BigQuery using Salesforce account IDs as a common identifier and tag each account with whether it belongs to our ideal customer profile (ICP). Data structure for our Mixpanel project.
Compared to one-time-purchase software, SaaS products offer a few key benefits. Another core benefit to digital products is that it’s possible to improve the userexperience over time (such as by adding new features or upsell Digital products make it possible to improve the userexperience over time.
In 2019, industry-leading Business Intelligence (BI) tools, Looker and Tableau, were acquired by Google and Salesforce for over $18 billion combined. It takes an expensive, time-consuming, up-front investment in data to realize the benefits of BI. The relative strengths and weaknesses can be summarized as follows. Implementation.
Starting a career as a business intelligence analyst requires understanding the key steps, skills, and experiences needed for success. The career path of a business intelligence analyst is not linear, but there are common stages you can expect as you gain experience and expertise. Without further ado, let’s get into it!
With its robust capabilities to expand your business, add value to your customers, and ultimately grow your profits, embedded analytics solutions are becoming essential for businesses that want to be able to survive in the market. Instead, users can look at key business data in context increasing their productivity and efficiency.
Our data obsession is why OkCupid makes more than 4 million connections every week, over 200 million a year, 5 million introductions a day, and gets more mentions in the New York Times wedding section than any other dating app. The more questions we ask, the more information we receive, and the better we can pair users with someone else.
Ever found yourself getting loads of feedback, but didn’t have the customer feedback system in place to do something with it all? Not only is it a mess for you, but it can also let your customers down when you don’t do something about their feedback. The customer feedback system learning.
Eventually, there came technologies to collect things like software user events automatically, which made data far more plentiful and turned the process of rendering sense of what you’ve gathered into the obstacle. By that time, you totally forget how to write the query again.”
Digital innovation is constantly shaping customer relationships, and Popmenu stands out for how it’s using Gainsight Essentials for its customer engagement and growth strategies. Buchanan and Greene offered several lessons on fostering digital customer engagement and driving successful customer outcomes.
Have you ever made a costly mistake because your customer feedback analysis wasn’t on point? Unfortunately, it’s happened to us; as one time is already too many for any growing SaaS company, we needed to come up with a way to improve our analysis process. What is Customer Feedback Analysis? People use complex language.
We organize all of the trending information in your field so you don't have to. Join 96,000+ users and stay up to date on the latest articles your peers are reading.
You know about us, now we want to get to know you!
Let's personalize your content
Let's get even more personalized
We recognize your account from another site in our network, please click 'Send Email' below to continue with verifying your account and setting a password.


Let's personalize your content