This site uses cookies to improve your experience. To help us insure we adhere to various privacy regulations, please select your country/region of residence. If you do not select a country, we will assume you are from the United States. Select your Cookie Settings or view our Privacy Policy and Terms of Use.
Cookie Settings
Cookies and similar technologies are used on this website for proper function of the website, for tracking performance analytics and for marketing purposes. We and some of our third-party providers may use cookie data for various purposes. Please review the cookie settings below and choose your preference.
Used for the proper function of the website
Used for monitoring website traffic and interactions
Cookie Settings
Cookies and similar technologies are used on this website for proper function of the website, for tracking performance analytics and for marketing purposes. We and some of our third-party providers may use cookie data for various purposes. Please review the cookie settings below and choose your preference.
Strictly Necessary: Used for the proper function of the website
Performance/Analytics: Used for monitoring website traffic and interactions
Founder, marketer, product manager? FinGuard — Dashboard for Smarter Financial Management Step 9. Minot — AI-Driven Task Management Platform Step 10. Ask yourself three questions: What problems will the dashboard solve? track revenue growth, spotlight funnel bottlenecks, monitor churn) Who makes decisions with this data?
This way, product managers, marketers, and designers can access insights without waiting for technical support. Looker Studio: Best for creating free, customizable dashboards with Google integrations. 5 Looker Studio is ideal for teams already using Googles ecosystem. Pricing is custom, with a 14-day free trial available.
If you’re not a subscriber, here’s what you missed this month: A guide to AI prototyping for product managers Introducing Core 4: The best way to measure and improve your product velocity Top angel investors in the U.S. Notion also came in second place for project management after Jira and fourth place for CRM.
Speaker: Andrew Wynn, Senior Product Manager, Looker
As a product manager, you know how helpful custom tailored data solutions can be to doing your job well. Learn product analytics best practices from Andrew Wynn, Product Manager at Looker. How Looker incorporates analytics in their product development process. Who builds products for the product people? And more.
Core Skills Through hundreds of job descriptions and interviews with hiring managers at companies like Meta, Amazon, and Uber, we identified the skills that actually matter. Data Visualization: Tools like Tableau, Power BI, or Looker are critical for communicating insights visually. Focus on the job description.
You're evaluated on your general coding abilities and expertise in designing robust data pipelines and managing complex data architectures. Apple Data Integration and Privacy for User-Centric Applications Ensuring data privacy, integration across diverse systems, and secure user data management.
Hiring Manager Interview: Ranges from casual fit-based discussions to deep dives into SQL or case problems. Candidates must know how to build and explain dashboards using tools like Tableau, Power BI, or Looker. Hiring managers look for ownership, cross-functional collaboration, and the ability to tie data work to business outcomes.
Template: Data Analyst Manager 📄 Copy this data analyst manager template. This is an example of a data analyst manager resume. Why this resume works ✅ Appeals to both hiring managers and executives. Hands-on experience with data visualization tools (Tableau, Power BI, Looker).
Speaker: Richard Cheng, Associate Product Manager, Mark43
Mark43 is on a mission to bring public safety data management into the 21st century. To fix traditionally paper-heavy and error-prone processes, they needed a secure and easy-to-use product experience that simplified and unified crime data collection and management. How efficient intelligence and analytics will benefit your users.
What Google’s and Salesforce’s respective acquisition of Looker and Tableau Software means for CIO’s The BI analytics tool space is consolidating to compete against Microsoft’s ensemble of Business Analytics(BA) products which promises to solve for the entire workflow?—?data With Google’s announcement to buy Looker for $2.6b
Andrew Wynn’s path to product management isn’t your typical story. Current Company : Looker. Since the time of writing, Andrew has left Looker to start his own company. In a perfect world, data plays a major, but not an exclusive, role in product management.” I use Evernote to manage my workflow.
Originally published June 2, 2022 By Brian LaFaille, former Global Head of CS Strategic Programs at Looker Digital Customer Success is for everyone. We caught up with Brian LaFaille, former Global Head of Customer Success Strategic Programs at Looker, to get his take on segmentation and how they score customers at Looker.
Up until now, that was handled by Mixpanel and Looker, our BI (business intelligence) solution of choice. I’d like to share how we worked with our product, engineering, and design teams to inspire and dogfood the best business analytics solution and what we’re gaining today by moving off of Looker. Second, cost became an issue.
Speaker: Sam Owens, Product Management Lead, Namely Platform
Sam and Jessica faced a problem that many product managers face: their customers wanted better analytics and reporting, but analytics wasn’t the core function of the SaaS product Sam and Jessica manage. Balanced competing priorities and managed expectations.
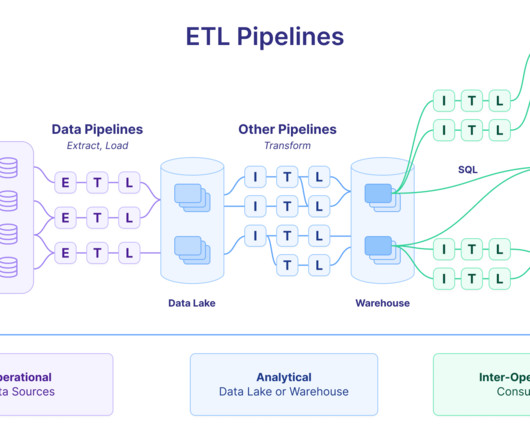
Adding to the complexity is the need to find the right tools to manage the different types of data — you can pound in a nail with a wrench, but that’s not what it’s built for. Product managers and marketing teams can use this data to understand how to grow, engage, and retain their user base. These tools (e.g.,
Prior to Dropbox, Todd led product management for Twitter’s Content and Discovery teams after selling his startup, Cover, to Twitter in 2014. He kickstarted his career at Google as an associate product manager and eventually led product for Gmail, witnessing its growth from beta to 200 million users.
In 2019, industry-leading Business Intelligence tools (BI tools), Looker and Tableau, were acquired by Google and Salesforce for over $18 billion combined. Looker, and other tools like it, are often deployed with good intent. This brings us to our second major challenge of BI tools as a product management tool.
Heap makes it easy for less data-savvy users to manage data from within the Heap interface. An excellent complement to BI tools, Indicative is great for ad hoc analysis and quick results that can take hours in Looker and Tableau. Google Tag Manager. Weaknesses: Indicative currently offers limited predictive analytics.
Speaker: Kate Owens and Megan Bubley, SpotHero, Diana Smith, Segment, and Erin Franz, Looker
Join our webinar on October 17th with Segment and Looker to hear how they have solved these complex data issues. Plus, hear from SpotHero’s Product Manager and Business Intelligence Lead, Megan Bubley and Kate Owens, as they describe how they not only unified their siloed data but aligned their team on what it all means.
It’s even harder when product managers and engineers are bogged down with work that distracts them from their highest leverage activities of identifying problems and building products people want to use to solve those problems. Project management. Roles Product Operations Managers (POM). Program management. Data analysis.
Nick has also held roles as Reddit’s VP of Engineering and Looker’s Chief Product and Engineering Officer. Between Microsoft, Reddit, Looker, and now Twitter, Nick’s worked for companies with vastly different cultures. Nick has also held roles as Reddit’s VP of Engineering and Looker’s Chief Product and Engineering Officer.
The different reports can offer a variety of insights that help manage your product in the right direction. Looker Studio can assist you in campaign performance tracking. Looker Studio. With companies relying entirely on data, it’s common sense to carry out SaaS reporting. If you want to know more, book a demo now.
There’s more information on hand than organizations know how to use or manage. As technology develops, analytics stacks become easier to set up, manage, and scale. Freshpaint automatically tracks every possible event, then provides a UI for users to create and manage those events. Manageability.
Speaker: Eric Feinstein, Professional Services Manager, Looker
For a long time, Product Managers have found it challenging to design interfaces inside their products that users could use for reporting. Eric Feinstein, Professional Services Manager at Looker, has done workshops with product managers who are looking to add effective reporting.
I’m a product manager at Monzo. As a product manager, you’re responsible for working with your team (and the other team leads) to set a tangible team goal that will help the company meet its goals. Mission : Help people repay their loans and manage financial difficulty. Make Sure Your Team Goals are Based on Company Goals.
Indicative enables product managers, marketers, and data analysts to make informed decisions by thoroughly understanding the complete customer journey, creating highly targeted behavioral segments, and optimizing product direction. Using a Business Intelligence tool such as Tableau or Looker? Contributors Statement.
Number of inbound contacts from account reps (otherwise known as Account Executives, Technical Account Managers), and CAC (cost of customer acquisition). 2 is key for most successful product managers, because it allows them to predict the future. that many customers worth profiling are not yet consuming your SaaS product.
Thanks to the Hootsuite integration, you can monitor and manage social media accounts and Zendesk tickets from one dashboard. With Agent Dashboard , you can integrate Looker, Power BI, and Tableau dashboards into Zendesk. Hootsuite and Zendesk integration Hootsuite is a well-known social media management platform.
You’ll learn how a semantic layer delivers massive ROI with streamlined query performance, concurrency, cost management, and ease of use. How a semantic layer delivers massive ROI with streamlined query performance, concurrency, cost management, and ease of use.
Embedded analytics benefits Top 7 embedded analytics platforms Reveal Looker Toucan Sisense Logi analytics Tableau Power BI. Overview: Acquired by Google in 2019, Looker is a browser-based, business intelligence platform that helps collect, analyze and visualize raw data. Table of contents: What are embedded analytics platforms?
If you use Looker, for instance, you probably rely on this platform’s data capabilities. SQL is the basis for many modern BI systems — including Looker and Tableau. Every company in the world needs data to strengthen its competitive footing. Reports pique people’s curiosity, so teams start asking for more analyses.
With many marketing professionals already using Google Analytics, you’ve likely seen instances of product teams “making it work” with some fancy tag management—but there are serious drawbacks to this approach. How is Mixpanel different from BI tools like Looker, Tableau, and Mode? Source: Semetis.
Buffer allows you to manage your entire social media strategy from one place and collect reports from across your networks. Alternatives: Microsoft BI, Looker. LeanData – lead management. Alternatives: Unbounce. Buffer – social media publishing. Conversions aren’t a nice, neat and organized path from point A to B.
In 2019, industry-leading Business Intelligence (BI) tools, Looker and Tableau, were acquired by Google and Salesforce for over $18 billion combined. More recently in 2020, cloud-based data warehouse Snowflake went public at an eye-popping market capitalization of $70 billion. Analysis depth vs. breadth.
We have a list of account properties that we track, including: The current ARR the accounts is paying Various measures of account health and adoption Whether the account is part of our ICP The sales team the account is assigned to Whether the account has a Customer Success Manager assigned to it What region the account is based in.
Here’s a breakdown of the typical career progression: Junior BI Analyst/Data Analyst (0-3 Years) BI Analyst (3-5 Years) Senior BI Analyst/Lead BI Analyst (5-10+ Years) BI Manager/Director (10+ Years) The path to becoming a business intelligence (BI) analyst is not a one-size-fits-all journey.
Looker Studio , formerly Google Data Studio, excels in collaborative, customizable analytics dashboards but may lack advanced reporting features. This tool simplifies data management , enabling you to focus on what matters most efficiently. What qualities to look for in dashboard software? Premium : $799/month.
.” Today, Tristan says product analytics tools like Mixpanel can return deep analysis of specific user and product topics through simplified, self-serve data questions—an operation that is “way worse in practice” through data visualization business intelligence (BI) tools, like Looker or Mode, he explains.
I’ve been with OkCupid for three years and I manage our data science team, which handles platform analytics. Our customer data stack at OkCupid consists of mParticle, Looker, and product intelligence (PI) platform Amplitude. They also have their limitations when it comes to the depth of insights we can glean from the data we have.
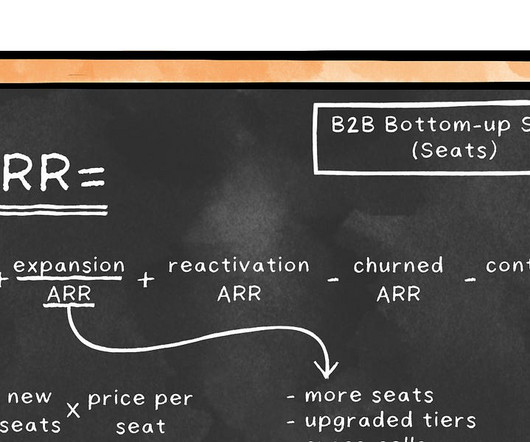
Top-down (sales-led) B2B SaaS Examples: Snowflake, Box, Salesforce, Workday, Looker This category includes both seat-based and usage-based pricing and normally ends up as a predetermined negotiated annual contract.
[link] Using Google Tag Manager : My preferred method is to use Google Tag Manager. This tool allows you to manage all your website tags in one place and makes it easier to deploy the tracking code. With Google Tag Manager installed on your website, you no longer need to manually edit the code.
Information overload – access to large amounts of data can lead to analysis paralysis and impair the manager’s ability to make timely decisions. Privacy and security – protecting customer data and ensuring compliance with data privacy regulations, such as GDPR or CCPA, is a significant challenge. Coupler.io
The focus of the first 30 days should be project alignment and if you’ve chosen to implement a feature flag management tool like Split, education. If you’re onboarding a tool to manage your feature flagging and experimentation, like Split, your next step is to go through the administration of said tool. The First 30 Days. Days 30-60.
We organize all of the trending information in your field so you don't have to. Join 96,000+ users and stay up to date on the latest articles your peers are reading.
You know about us, now we want to get to know you!
Let's personalize your content
Let's get even more personalized
We recognize your account from another site in our network, please click 'Send Email' below to continue with verifying your account and setting a password.


Let's personalize your content