This site uses cookies to improve your experience. To help us insure we adhere to various privacy regulations, please select your country/region of residence. If you do not select a country, we will assume you are from the United States. Select your Cookie Settings or view our Privacy Policy and Terms of Use.
Cookie Settings
Cookies and similar technologies are used on this website for proper function of the website, for tracking performance analytics and for marketing purposes. We and some of our third-party providers may use cookie data for various purposes. Please review the cookie settings below and choose your preference.
Used for the proper function of the website
Used for monitoring website traffic and interactions
Cookie Settings
Cookies and similar technologies are used on this website for proper function of the website, for tracking performance analytics and for marketing purposes. We and some of our third-party providers may use cookie data for various purposes. Please review the cookie settings below and choose your preference.
Strictly Necessary: Used for the proper function of the website
Performance/Analytics: Used for monitoring website traffic and interactions
The following data and information on Travel apps is from our 2022 Mobile App Customer Engagement Report. Subcategories for Travel Apps: Transportation, Hospitality & Tourism, Auto. In 2021, Travel began its road to recovery following interstate, national, and global travel restrictions brought on by the pandemic.
It could be the driving force in making data-driven product roadmap decisions and having a comprehensive view of customer sentiment. Our 2019 Mobile Benchmarks by App Category report looks at trends and differences across popular app categories, with a focus on Travel apps. Profile of an average app in the Travel category.
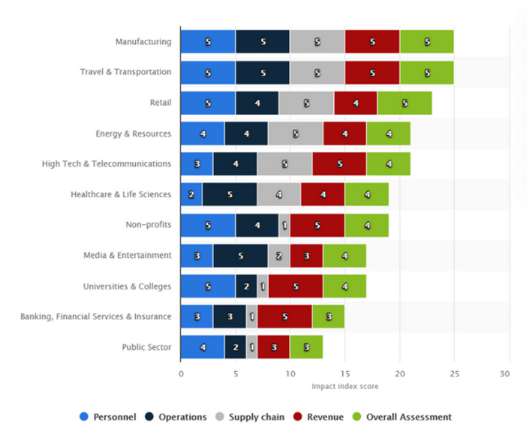
According to a report by Statista , this is how various industries have been impacted by the pandemic. The data used throughout this post is from anonymized, US-based Apptentive customers’ iOS apps. For example, apps that historically seen predictable weekly trends in usage are now seeing entirely new patterns. ?Read
This report contains data from the following app categories: Finance. Personal Services. Business Services. Download a complimentary copy of the report now to see how your app performed against the marketplace and to help set new, data-backed engagement goals for 2022. Food and Drink. Healthcare.
While travel looks like it will remain relatively unpopular in the first half of 2021 due to COVID concerns, travel brands are gearing up for a surge of travelers in the second half of the year. Back in May of 2020, we dug into the mobile data to reveal changes in DAU (daily active users) across different industries.
Today, we’re thrilled to release our 2021 Mobile App Engagement Benchmark Report. Apptentive’s annual mobile app engagement benchmark report serves as a baseline to help you understand your app’s engagement strengths and areas for improvement. What’s New in the 2021 Report. See the Report.
Brands in the Business Services category faced diverse 2020 challenges. In our 2021 Mobile App Engagement Benchmark Report , a study of 1,000 apps across a billion+ app installs, we take a close look at apps in the Business Services category. Below is a summary of our research specifically on Business Services apps.
Now that the COVID pandemic is over, travel management systems are valuable because business travel is back on the table. The term “business travel” might easily evoke images of a glittering world filled with business-class flights, expensive corporate dinners, luxury hotel stays, and various enjoyable activities.
But if you have a breather, we’re excited to share some data-backed mobile engagement findings, specifically surrounding how seasonality impacts customer sentiment! While we can hypothesize that the lack of Vitamin D certainly contributes to grumpier customers in the gloomier months, we needed data to support our claims.
For example, the travel and events management software, Groupize, created an interactive assistant – G.G. Other gamification elements include: Rewards Badges Creativity tools Pressure Progress bars Challenges Explore more gamification examples. Frequency of reported issue. No guesswork, just data. The result?
Maybe you’ve even tried some popular AI tools, like the good ol’ ChatGPT. But did you know that certain AI tools work best at specific phases of the design process? Having tested a selection of AI design tools, I’ve found that some are better suited for certain stages of the UX design process than others. What do I mean by that?
If there’s one industry that was impacted the most by COVID-19, it might be the travel industry. One of the primary locations that travel brands interact with customers is through their mobile apps. Usually, this is the easiest place for customers to quickly make changes to flight reservations and travel plans.
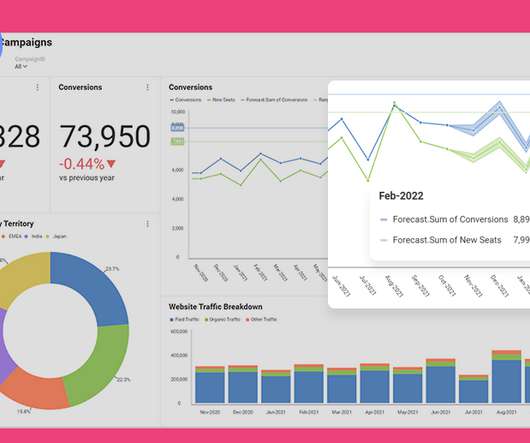
The article here focusses on business criterion to use to better evaluate if a predictive model is ready for production and the associated risk when the predictions are wrong. Optimized for better outcomes Today, businesses regularly use predictiveanalytics to optimize their business and achieve better business outcomes.
Christy and Ashley share findings from Apptentive’s annual mobile app engagement benchmark report , which is based on data from more than 1 billion mobile consumer voices. They share insights applicable across the mobile landscape, as well as benchmarks specific to your industry.
Voice search in the travel and hospitality industry has switched the way people search for information. Let’s look ahead to the future voice search applications in the service-oriented industry as hospitality and travel. Meanwhile, the Digital Marketing Institute reports about 30% of all hospitality tech is screenless.
Do you want to know how your mobile app engagement data compares to others in your industry? Luckily, we’ve got the data to help you see exactly how others in your category are performing. We’ve gathered and analyzed customer engagement data from the mobile apps in the following categories: Finance. Food & Drink.
Like any form of analytics, product marketing analytics is all about capturing key data and optimizing the customer experience using that data. Unlike marketing analytics which focuses on replicating marketing successes, product analytics focuses on improving the product. What is product analytics?
Wondering what tools you should have in your PLG tech stack to guarantee business success? Successful SaaS companies don’t rely on a single tool doing all the work to drive product-led growth but a multitude of tools specializing in different tasks simultaneously. Ready to execute your PLG strategy?
Does your business need more than session replays and quantitative data? However, the best product analyticstools for you depend on factors other than having a wider range of features. So let’s go over the best LogRocket alternatives, their ideal use cases, and how each tool compares to it so you can choose the right product.
We do this because it is difficult to predict whether a feature will indeed help us meet a particular outcome. Because we will most certainly be missing some data to make a clear call, decisions need to be agreed collaboratively at team-level. Is it legal to use their data in the way we aim to do?
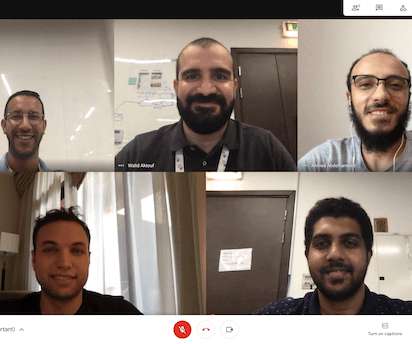
For this story, we spoke with a product team leading the Digital Hotels vertical at Seera Group , a travel and tourism company based in the Kingdom of Saudi Arabia (KSA). The words “travel” and “2020” don’t feel like they belong in the same sentence. Unless, of course, that sentence is, “I had to cancel all my travel plans in 2020.”.
“We are a data-driven company”. You’ll travel far and wide before you find a tech startup that doesn’t pride itself on this claim. And, while the logic behind a data-driven approach is undeniable, too often the expectations that come with it aren’t met. Improper Testing.
With the right product research tools, you can dissect vast pools of data, gather actionable insights, and create products that align directly with your user’s needs. For that reason, we’ll go over 12 of the best tools you should use when conducting product research. UXPressia. Productboard.
Using KPIs and collecting the relevant data helps you balance intuition with empirical evidence. This includes the analyticstools we have available today. These powerful tools usually generate more data for us than we can handle. In the worst case, you act on irrelevant data and make wrong decisions.
Being a product manager in a B2B service company, the question was particularly difficult to answer. It is a good tool to have and can be used over and over again. . In a service as a product company, there are not consistently clear starting and finishing lines for product management. More About The Product Mentor.
Reveal Embedded Analytics. Businesses of all industries and all sizes incorporate embedded analytics technologies and capabilities into their own software, SaaS platforms, Angular apps , or other apps because of the tremendous benefits that they get. See Reveal in Action. CRM: Maximize customer lifetime value.
With that in mind, the most decisive tool you have when facing uncertainty is knowledge. The Data / Information / Knowledge Paradox (Drawn From the DIKW Pyramid ). Data : data is feedback from your users, your market, or your product. Information: information is the output of data, after analysis. Analytical.
Kelsey oversaw three product squads and reported to the VP of Product, David Krell. And how do we visualize that thinking in that shared sandbox so that we can help eradicate our individual blind spots?” For this iteration, they began talking to customers to learn more about how people travel. I have some rigidity.”
Governments, corporations, and innovators are embracing its potential to redefine how we handle data, security, and transactions. Its decentralization magic is unlocking new ways to secure data, ensure transparency, and streamline operations. From a niche concept embraced by tech enthusiasts, it’s evolved into a global phenomenon.
“Beyond code, beyond visuals and interactions, what do all these apps have in common with each other? Lots of social stuff, banking, travel, local services, fitness, cooking, more than a few games, even apps made by governments. Travel: (Airbnb, Ryanair) 35.5%. Travel: (Airbnb, Ryanair) 35.5%.
It has helped in gaining alignment on complex topics with senior leaders at Meta (Sheryl Sandberg, Chris Cox, and Andrew Bosworth), paving the way for key launches like Facebook digital well-being tools , privacy protections for youth , and Quest referrals. Let’s go through the steps and action items.
That’s why product analytics is a razor-sharp tool for product leaders. Product analytics is the machete that you can use to slice through the thickest feedback and shape your product growth strategy. In this article, we lay out the five ways product analytics enhance your customer’s experience and make your job easier.
Consumer goods has the lowest shopping cart abandonment rate while Travel companies, automotive industry, fashion and luxury products have the most abandoned carts. Key questions Two important questions that need to be asked are Can we predict card abandonments and take proactive action before it happens? This is a long list.
For two of his years at Amazon, Colin was Chief of Staff to Jeff Bezos, AKA “Jeff’s shadow,” during which he spent each day attending meetings, traveling with, and discussing business and life with Jeff. He is also the co-author of Working Backwards: Insights, Stories, and Secrets from Inside Amazon. It’s an iterative process.
I worked in product management in financial services in London for a couple of years. Tools to Become More Empathetic. Fortunately, there are tools and frameworks available to help you and those around you to become more empathetic. Personas can be a powerful tool to remind you of the diversity of your customer base.
Epics are also useful when describing features to an end-user of your product or service when collecting feedback. If done correctly, this document can be a powerful tool that motivates your design & engineering team by setting ambitious yet achievable & well-planned goals. Quarterly Objectives. Research article.
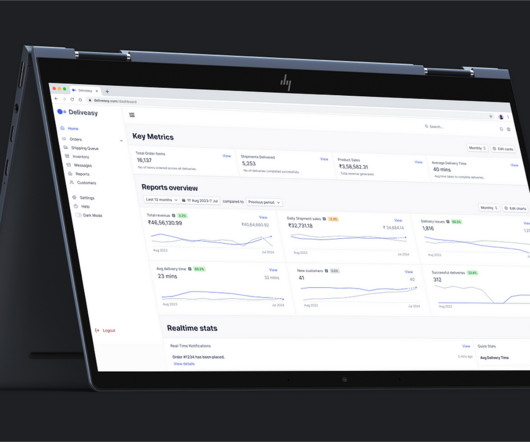
Deliveasy enhances delivery efficiency and customer satisfaction for Indian supermarkets with real-time tracking, route optimization, and detailed analytics. How might we optimize delivery routes to reduce travel time and costs with lesser team size? From 2019 to 2022, MENA and Indonesia saw over 100% CAGR, while India had a 66% CAGR.
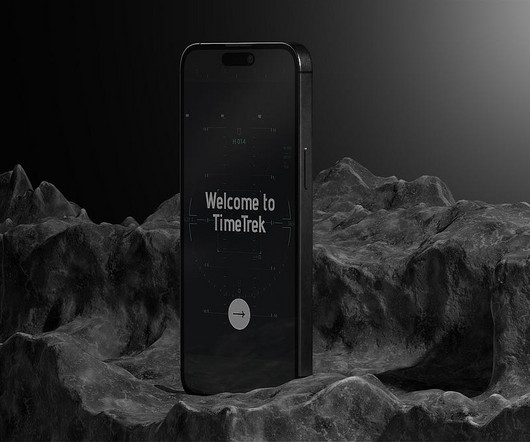
TimeTrek: Crafting a Time-Travel Experience — UX Case Study Imagine if you could travel to any time and place on earth. Brief To build an experience for the users to discover a time & place and book a time travel trip on the mobile app. Justification: Sets the scene for the user, grounding them in the time travel experience.
In our 2021 Mobile App Engagement Benchmark Report , a study of 1,000 apps across a billion+ app installs, we take a close look at apps in the Utilities category. Read on for data-supported benchmarks Utilities apps should focus on in 2021 and beyond based on what was learned from a year like no other. Ratings and Reviews.
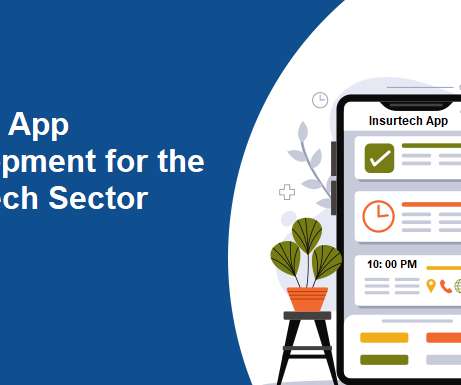
But given the fact that this industry demands different touchpoints for its clients, it is only appropriate for insurance companies to make their services more accessible and in turn, keep track of their customers via mobile apps. Insurance companies can structure, analyze and use this data to offer personalized or appropriate services.
Jordan has enterprise Software-as-a-Service experience within the facilities management, legal and pharmaceutical verticals, having most recently worked at ServiceChannel, Epiq Systems and Medidata Solutions. Paul Hurwitz Director of Active Analytics, ActiveHealth Management. James Alexander Founder and Head of Product, Vizibility.
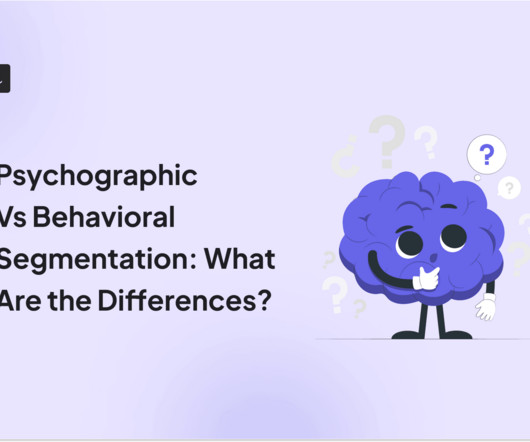
In this article, we’ll explore these two concepts, their differences, and how to use product analytics and feedback to segment customers in Userpilot. These concepts differ based on the following criteria: Data collection : Use surveys , focus groups, and interviews to collect psychographic data. Let’s dive in. Get a demo.
With a sufficiently large data set of your own users, you will find that their behaviors, goals, and pain points will be quite different from each other’s – let alone your own. Traditional UX work can yield complex deliverables, like 40-page usability reports or persona spreadsheets with intricate details.
Each group was read the parable of the Good Samaritan – the story of a Samaritan coming to the aid of a distressed traveller after others have ignored their plight. Again, how religious they reported being before the test had no bearing on the outcome. The participants were then asked to move to another building to complete the test.
We organize all of the trending information in your field so you don't have to. Join 96,000+ users and stay up to date on the latest articles your peers are reading.
You know about us, now we want to get to know you!
Let's personalize your content
Let's get even more personalized
We recognize your account from another site in our network, please click 'Send Email' below to continue with verifying your account and setting a password.


Let's personalize your content